

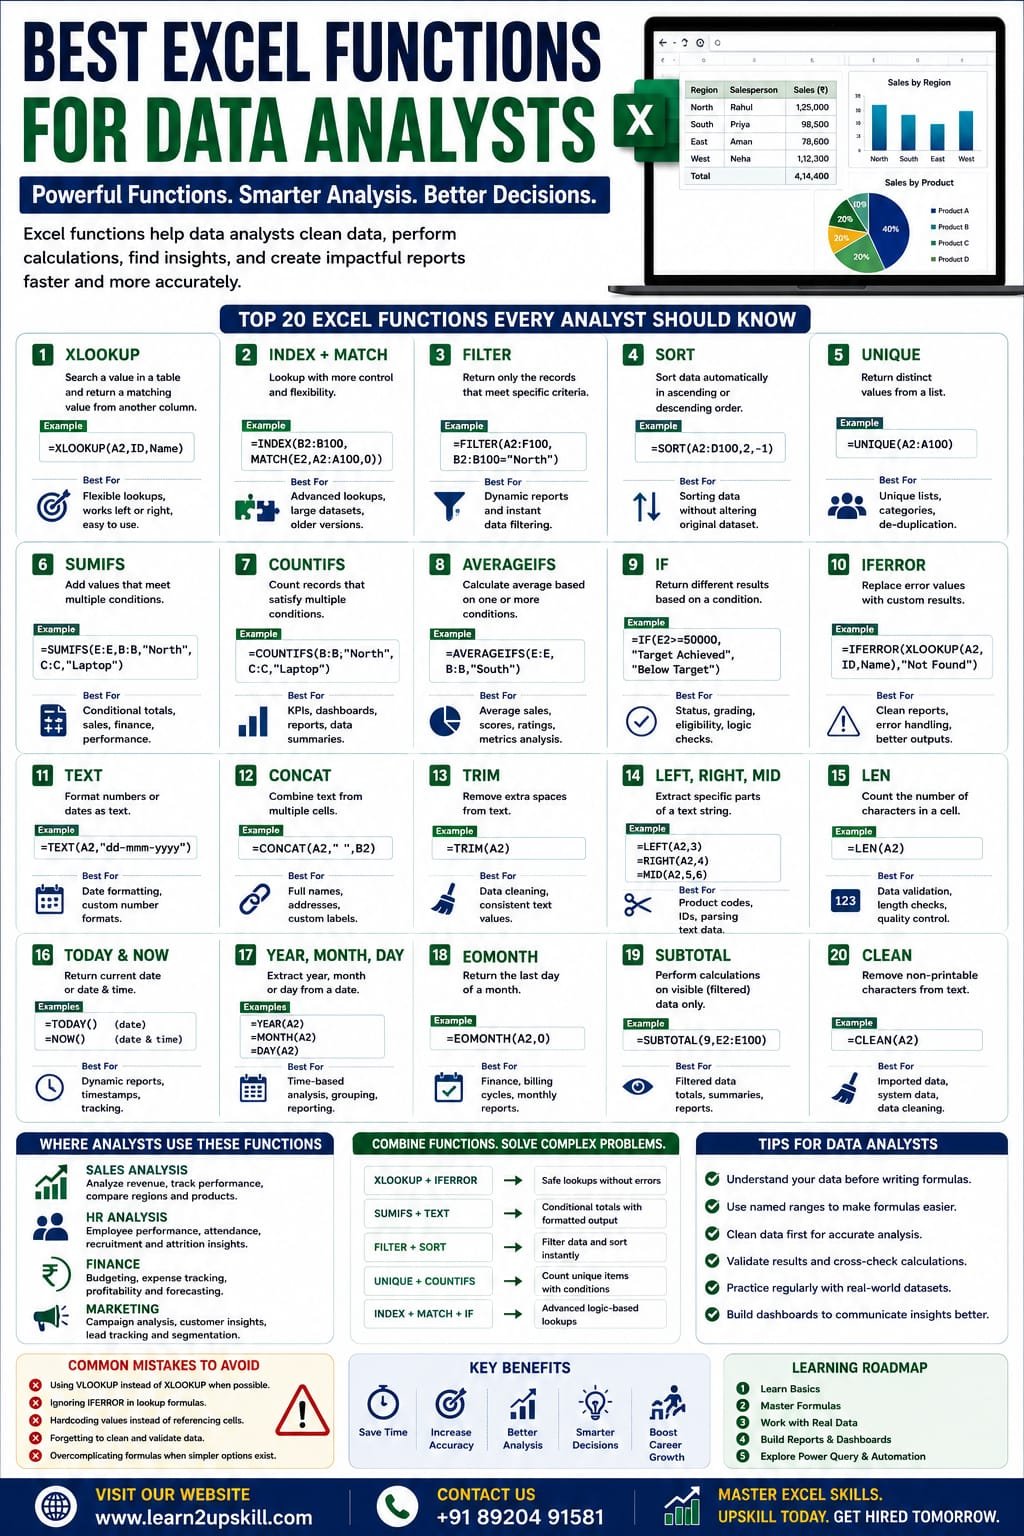
Best Excel Functions for Data Analysts
Best Excel Functions for Data Analysts
Learn the best Excel functions for data analysts, including XLOOKUP, INDEX, MATCH, FILTER, SUMIFS, COUNTIFS, IF, TEXT, UNIQUE, SORT, and more with practical examples.
Focus Keyword: Best Excel Functions for Data Analysts
Best Excel Functions for Data Analysts
Data analysts work with large amounts of information every day. Their responsibilities often include cleaning data, finding trends, creating reports, building dashboards, and presenting insights that help businesses make better decisions.
Microsoft Excel remains one of the most widely used tools for data analysis because of its flexibility and powerful built-in functions.
If you’re planning a career in data analytics or want to improve your Excel skills, mastering the right functions can dramatically increase your productivity.
In this guide, we’ll explore the most useful Excel functions for data analysts, explain when to use them, and provide practical examples.
Why Excel Functions Matter for Data Analysts
Excel functions help analysts:
– Automate repetitive calculations
– Analyze large datasets
– Clean messy data
– Create accurate reports
– Build dashboards
– Save time
– Reduce manual errors
Knowing the right functions allows you to focus more on interpreting data and less on repetitive tasks.
- XLOOKUP
Purpose
Search for a value in one table and return a matching value from another column.
Example
Employee ID → Employee Name
=XLOOKUP(A2,EmployeeID,EmployeeName)
Why Analysts Use It
– Replaces many VLOOKUP use cases
– Searches left or right
– Returns exact matches by default
– Easier to read and maintain
- INDEX + MATCH
Purpose
Perform flexible lookups when more control is needed.
=INDEX(B2:B100,MATCH(E2,A2:A100,0))
Best For
– Dynamic lookups
– Large datasets
– Older Excel versions without XLOOKUP
- FILTER
Purpose
Return only records that meet specific criteria.
Example:
Show all sales from the North region.
=FILTER(A2:F100,B2:B100=”North”)
Why It’s Useful
Eliminates manual filtering and creates dynamic reports.
- SORT
Purpose
Sort data automatically.
Example:
=SORT(A2:D100,2,-1)
This sorts the data by the second column in descending order.
- UNIQUE
Purpose
Return distinct values from a list.
Example:
=UNIQUE(A2:A100)
Useful for:
– Customer lists
– Product categories
– Department names
- SUMIFS
Purpose
Add values that meet multiple conditions.
Example:
=SUMIFS(E:E,B:B,”North”,C:C,”Laptop”)
This calculates sales for laptops sold in the North region.
- COUNTIFS
Purpose
Count records that satisfy multiple conditions.
Example:
=COUNTIFS(B:B,”North”,C:C,”Laptop”)
Ideal for creating KPIs and summary reports.
- AVERAGEIFS
Purpose
Calculate averages based on one or more conditions.
Example:
=AVERAGEIFS(E:E,B:B,”South”)
Useful for average sales, attendance, scores, or performance metrics.
- IF
Purpose
Return different results depending on whether a condition is true or false.
Example:
=IF(E2>=50000,”Target Achieved”,”Below Target”)
Common uses include performance tracking, grading, and status indicators.
- IFERROR
Purpose
Replace error messages with cleaner results.
Example:
=IFERROR(XLOOKUP(A2,ID,Name),”Not Found”)
This prevents errors such as “#N/A” from appearing in reports.
- TEXT
Purpose
Format numbers and dates for display.
Example:
=TEXT(A2,”dd-mmm-yyyy”)
Useful when preparing reports for presentation.
- CONCAT
Purpose
Combine text from multiple cells.
Example:
=CONCAT(A2,” “,B2)
Great for creating full names, addresses, or custom labels.
- TRIM
Purpose
Remove extra spaces from imported or manually entered text.
Example:
=TRIM(A2)
An essential function for data cleaning.
- CLEAN
Purpose
Remove non-printable characters.
Example:
=CLEAN(A2)
Useful when importing data from external systems.
- LEFT, RIGHT & MID
These text functions extract parts of a string.
Examples:
=LEFT(A2,3)
=RIGHT(A2,4)
=MID(A2,5,6)
Common uses:
– Product codes
– Employee IDs
– Invoice numbers
- LEN
Purpose
Count the number of characters in a cell.
Example:
=LEN(A2)
Helpful for validating text length and identifying inconsistencies.
- TODAY and NOW
TODAY
=TODAY()
Returns the current date.
NOW
=NOW()
Returns the current date and time.
Useful for dynamic reports and aging calculations.
- YEAR, MONTH & DAY
Extract components from dates.
Examples:
=YEAR(A2)
=MONTH(A2)
=DAY(A2)
Useful for grouping and analyzing time-based data.
- EOMONTH
Purpose
Return the last day of a month.
Example:
=EOMONTH(A2,0)
Widely used in finance and monthly reporting.
- SUBTOTAL
Purpose
Calculate totals while respecting filtered data.
Example:
=SUBTOTAL(9,E2:E100)
This returns the sum of only the visible rows.
Real-World Examples
Sales Analysis
Functions:
– SUMIFS
– XLOOKUP
– FILTER
– SORT
Use them to compare regions, products, and salespeople.
HR Reports
Functions:
– COUNTIFS
– IF
– AVERAGEIFS
– TEXT
Useful for attendance, recruitment, and performance analysis.
Finance
Functions:
– SUMIFS
– EOMONTH
– IFERROR
– SUBTOTAL
Ideal for budgeting, expense tracking, and financial reporting.
Marketing
Functions:
– FILTER
– UNIQUE
– COUNTIFS
– SORT
Analyze campaign performance, customer segments, and lead sources.
Tips for Data Analysts
– Organize data using Excel Tables.
– Keep formulas simple and readable.
– Use named ranges where appropriate.
– Clean data before analysis.
– Validate formula results.
– Combine functions to solve complex problems.
Common Mistakes
– Using VLOOKUP when XLOOKUP is available and more suitable.
– Ignoring IFERROR in lookup formulas.
– Forgetting to clean imported data.
– Hardcoding values instead of referencing cells.
– Using overly complex nested formulas when simpler options exist.
Final Thoughts
Excel remains one of the most powerful and practical tools for data analysis. By mastering functions such as XLOOKUP, INDEX + MATCH, FILTER, SORT, UNIQUE, SUMIFS, COUNTIFS, IF, and TRIM, you can analyze data more efficiently, create insightful reports, and improve your productivity.
The best way to become proficient is through regular practice with real-world datasets. Build dashboards, solve business problems, and continue learning advanced features as your skills grow.
At Learn2Upskill, we provide practical Excel training, real-world projects, and career-focused courses to help students and professionals succeed in data analytics and business reporting.
Visit: www.learn2upskill.com
Contact Us: +91 89204 91581
Master Excel. Analyze Data with Confidence. Advance Your Career.
You May Also Like
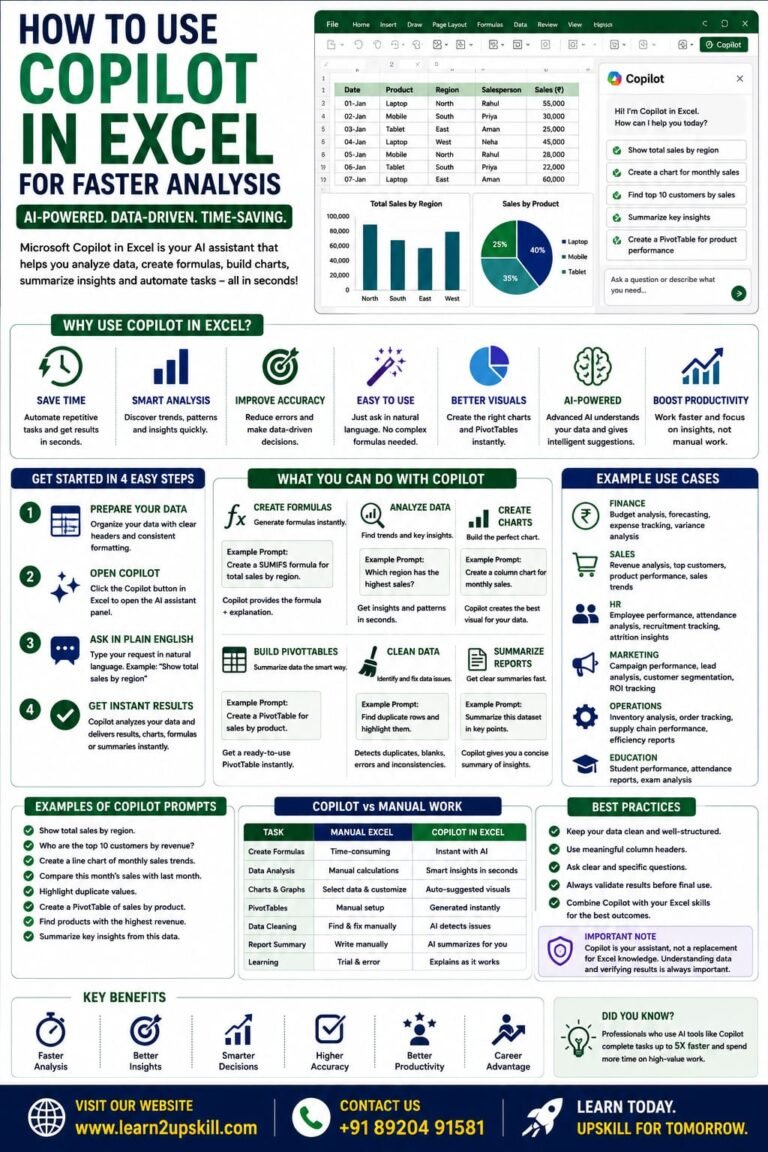
How to Use Copilot in Excel for Faster Analysis Learn how to use Microsoft Copilot in Excel to analyze data...
-
-
July 21, 2026
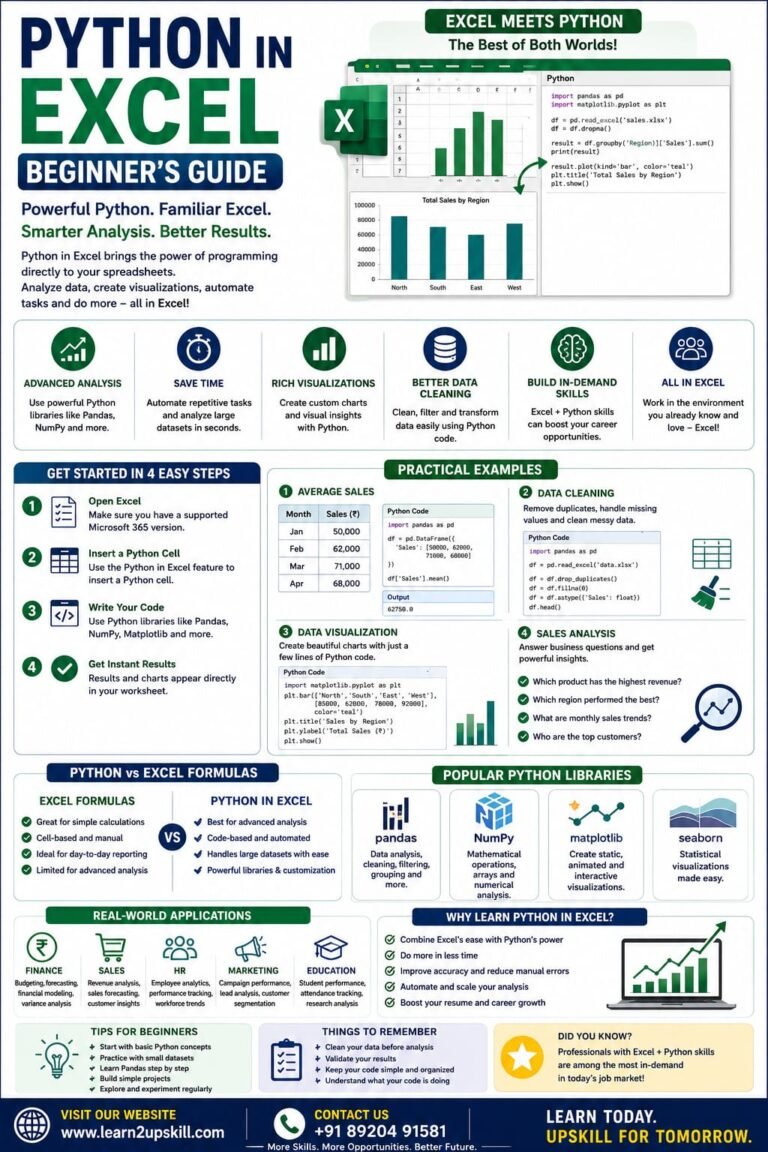
Python in Excel Learn how to use Python in Microsoft Excel with this beginner-friendly guide. Discover setup, syntax, examples, benefits,...
-
-
July 20, 2026
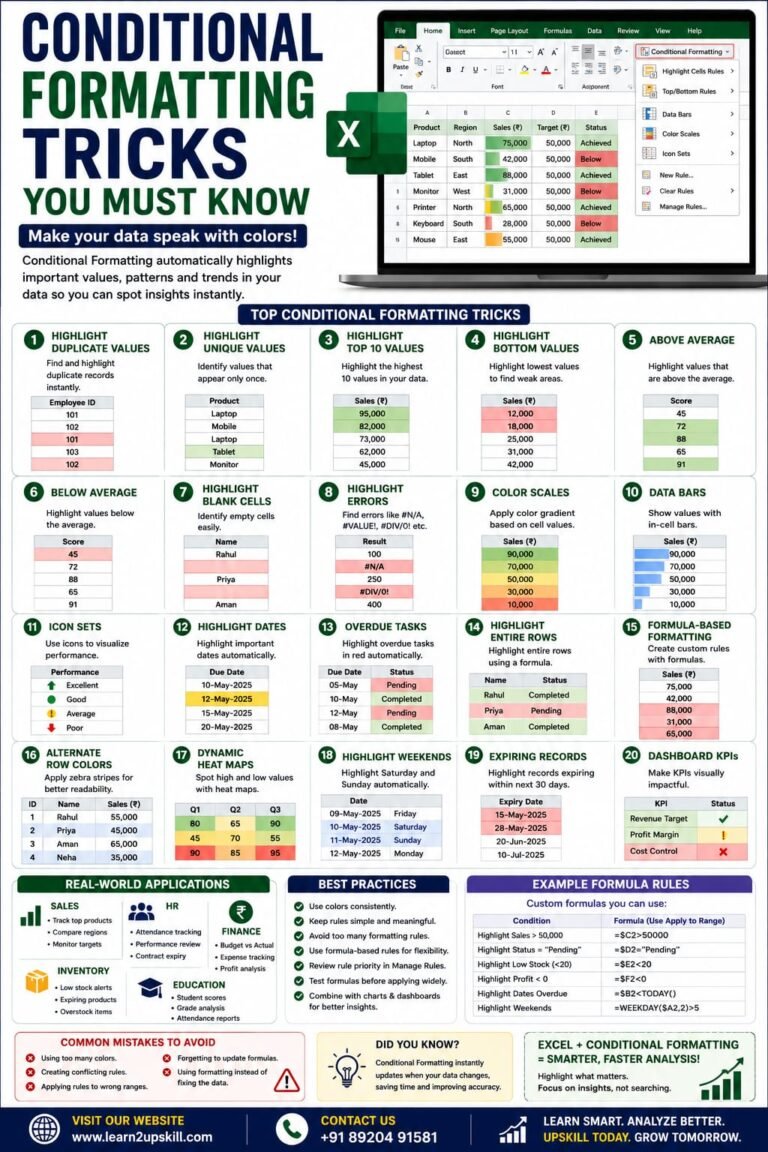
Conditional Formatting Tricks You Must Know) Learn the best Conditional Formatting tricks in Excel with practical examples. Highlight duplicates, overdue...
-
-
June 12, 2026