

Python in Excel
Python in Excel
Learn how to use Python in Microsoft Excel with this beginner-friendly guide. Discover setup, syntax, examples, benefits, limitations, and real-world use cases for data analysis.
Python in Excel: Beginner’s Guide
Microsoft Excel has long been the go-to tool for data analysis, reporting, and business intelligence. Now, with Python integrated into Excel, users can perform advanced data analysis, create powerful visualizations, automate repetitive tasks, and work with large datasets—all without leaving Excel.
For beginners, this combination opens the door to learning programming while continuing to work in the familiar Excel environment.
In this guide, you’ll learn what Python in Excel is, how it works, its benefits, practical examples, and how to start using it.
What Is Python in Excel?
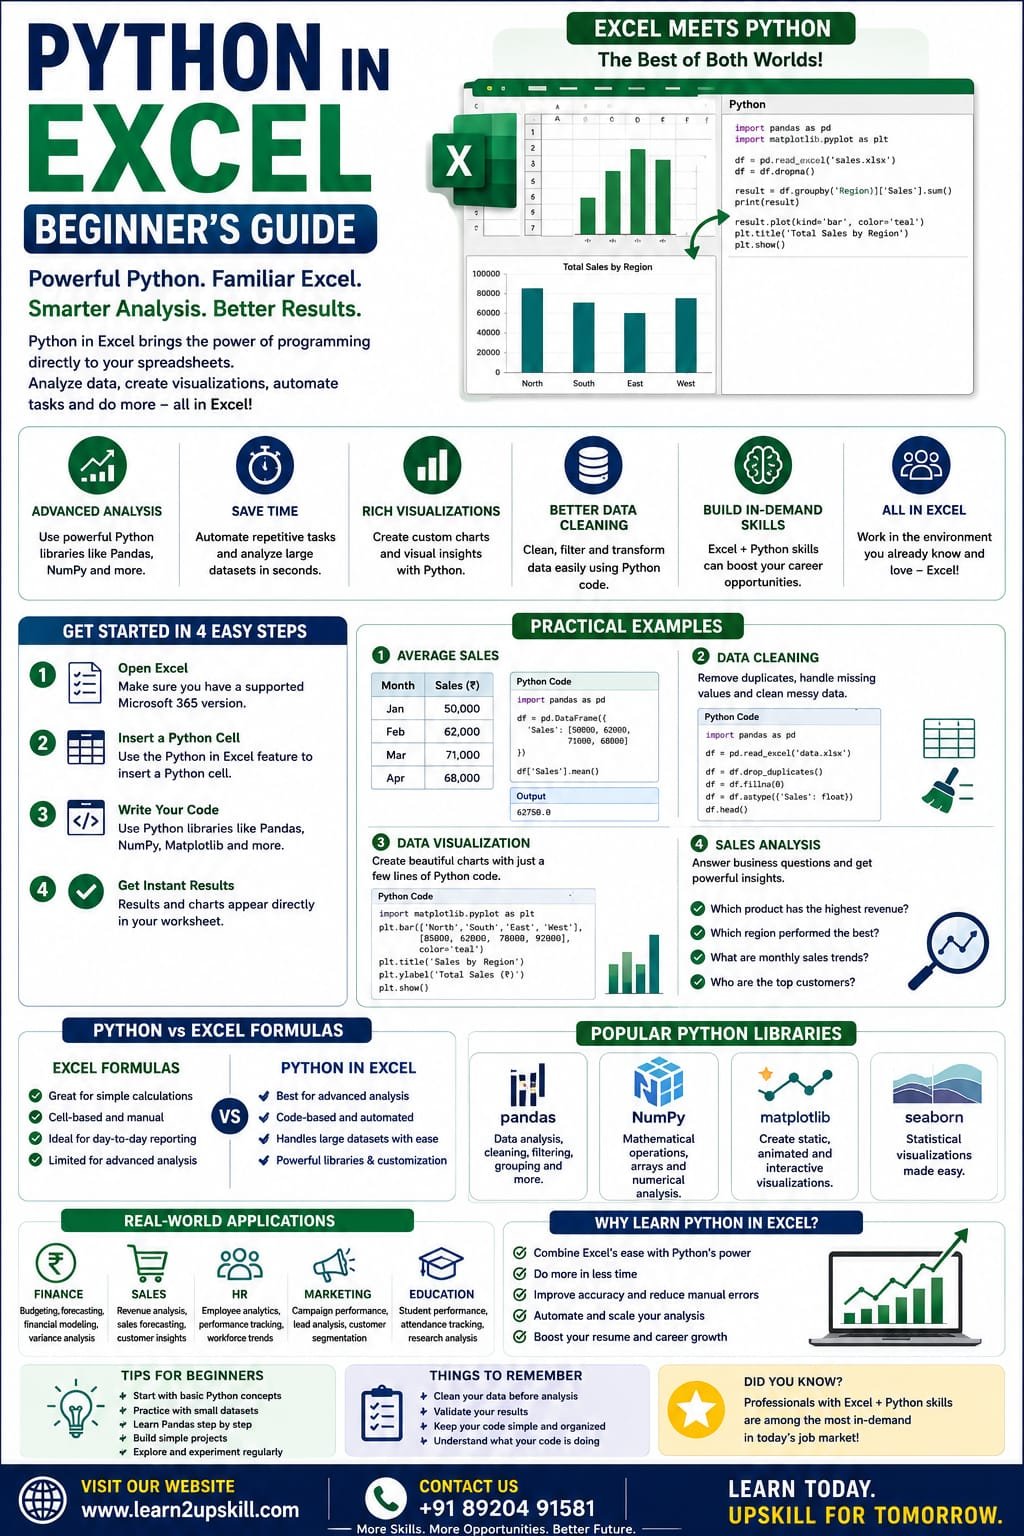
Python in Excel is a feature that allows you to write and execute Python code directly inside Excel worksheets.
Instead of switching between Excel and a separate Python environment, you can combine Excel’s spreadsheet capabilities with Python’s powerful data analysis libraries.
This enables you to:
– Analyze large datasets
– Perform statistical calculations
– Create advanced charts
– Clean and transform data
– Automate repetitive analysis
– Use machine learning workflows (where supported)
Why Learn Python in Excel?
Learning Python in Excel offers the best of both worlds.
You continue using Excel while gaining access to Python’s advanced capabilities.
Benefits include:
– Faster data analysis
– Advanced calculations
– Powerful visualizations
– Better automation
– Improved productivity
– Valuable career skills
Who Should Learn Python in Excel?
Python in Excel is useful for:
– Students
– Data Analysts
– Financial Analysts
– Accountants
– Business Analysts
– HR Professionals
– Marketing Analysts
– Researchers
– Engineers
– Excel Power Users
Prerequisites
Before learning Python in Excel, it’s helpful to know:
– Basic Excel formulas
– Tables and charts
– Pivot Tables
– Basic data cleaning
No prior Python experience is required to get started.
How Does Python Work in Excel?
Instead of using traditional Excel formulas, you can insert Python code into dedicated Python cells.
Excel executes the code and returns the results directly in your workbook.
This makes it possible to combine spreadsheet calculations with Python-based analysis in a single file.
Common Python Libraries Available
Python in Excel supports several popular libraries, including:
Pandas
Used for:
– Data cleaning
– Data analysis
– Filtering
– Grouping
– Merging datasets
—
NumPy
Useful for:
– Mathematical calculations
– Arrays
– Statistical operations
– Numerical analysis
—
Matplotlib
Creates charts such as:
– Line charts
– Bar charts
– Scatter plots
– Histograms
—
Seaborn
Helps create advanced statistical visualizations with minimal code.
—
Getting Started
Step 1
Open Microsoft Excel (supported Microsoft 365 version with Python in Excel).
—
Step 2
Create or open a workbook.
—
Step 3
Insert a Python cell using the Python feature available in supported versions.
—
Step 4
Write your Python code.
Example:
numbers = [10, 20, 30, 40]
sum(numbers)
Output:
100
—
Example 1: Average Sales
Dataset
Month| Sales
Jan| 50000
Feb| 62000
Mar| 71000
Apr| 68000
Python can calculate averages, trends, and additional statistics with concise code.
—
Example 2: Data Cleaning
Suppose your dataset contains:
– Blank cells
– Duplicate entries
– Extra spaces
Using Python with libraries such as Pandas, you can efficiently:
– Remove duplicates
– Fill missing values
– Standardize text
– Convert data types
This is especially useful for large datasets.
—
Example 3: Data Visualization
Instead of relying only on Excel charts, Python can generate customized visualizations for deeper analysis.
Common chart types include:
– Bar Charts
– Line Charts
– Scatter Plots
– Histograms
– Box Plots
—
Example 4: Sales Analysis
Imagine you have 50,000 sales records.
Python can quickly answer questions like:
– Which product generated the highest revenue?
– Which region had the best performance?
– What were the monthly sales trends?
– Who were the top customers?
—
Python vs Excel Formulas
Excel Formula| Python
Easy for simple calculations| Better for advanced analysis
Cell-based formulas| Code-based workflows
Great for everyday reporting| Excellent for automation and large datasets
Limited programming features| Extensive programming capabilities
—
Advantages of Python in Excel
- Handles Large Datasets
Python is well-suited for analyzing datasets that would be cumbersome to process manually.
—
- Better Automation
Reduce repetitive work by automating common analysis tasks.
—
- Advanced Analytics
Perform statistical analysis and complex data transformations.
—
- Rich Visualizations
Create detailed charts beyond Excel’s standard options.
—
- Career Growth
Python and Excel are both highly valued skills in data-related careers.
—
Limitations
– Available only in supported Microsoft 365 environments.
– Requires some learning of Python syntax.
– Not every Python package is available in Excel.
– Some advanced workflows may still require external development environments.
—
Real-World Applications
Finance
– Budget analysis
– Forecasting
– Financial modeling
—
Sales
– Revenue analysis
– Customer segmentation
– Sales forecasting
—
HR
– Employee analytics
– Attendance reports
– Workforce trends
—
Marketing
– Campaign performance
– Customer insights
– Lead analysis
—
Education
– Student performance analysis
– Attendance tracking
– Research data analysis
—
Tips for Beginners
– Learn Excel fundamentals first.
– Start with basic Python concepts such as variables and lists.
– Practice using small datasets.
– Explore Pandas for data analysis.
– Build simple projects before moving to advanced topics.
—
Common Mistakes to Avoid
– Ignoring data quality before analysis.
– Writing overly complex code for simple tasks.
– Forgetting to validate results.
– Relying on automation without understanding the underlying data.
Python in Excel represents a significant step forward for spreadsheet users. It combines Excel’s familiar interface with Python’s powerful programming capabilities, making advanced data analysis more accessible than ever.
Whether you’re a student beginning your data journey or a professional looking to automate reports and analyze larger datasets, learning Python in Excel can improve your productivity and expand your career opportunities.
At Learn2Upskill, we help students and professionals master Excel, Python, AI tools, and data analytics through practical, career-focused learning.
Visit: www.learn2upskill.com
Contact Us: +91 89204 91581
Learn Excel. Learn Python. Build the Skills Employers Want.
You May Also Like
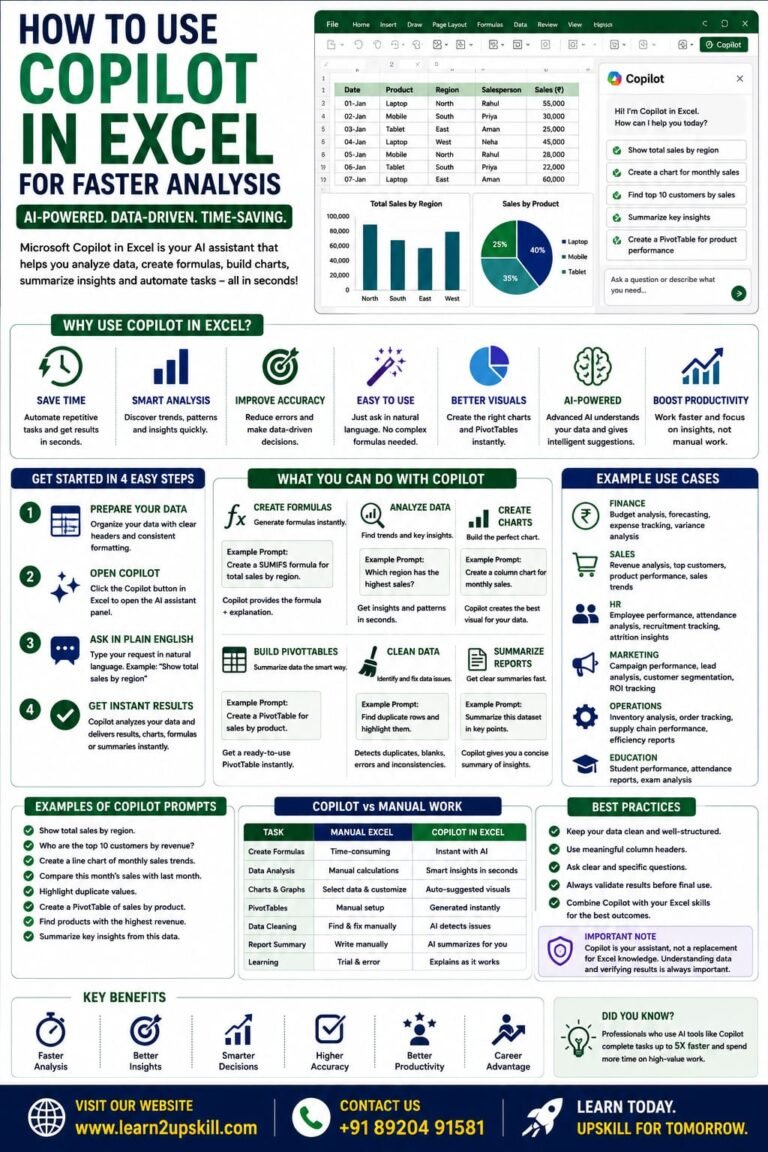
How to Use Copilot in Excel for Faster Analysis Learn how to use Microsoft Copilot in Excel to analyze data...
-
-
July 21, 2026
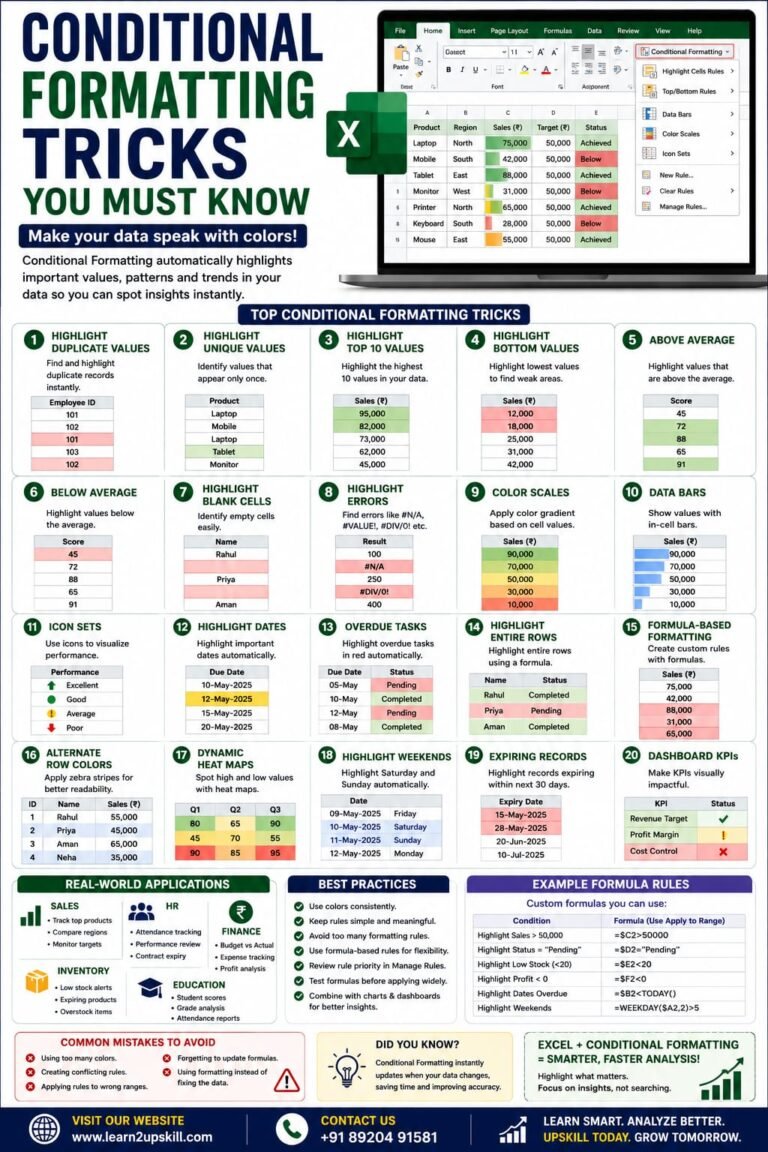
Conditional Formatting Tricks You Must Know) Learn the best Conditional Formatting tricks in Excel with practical examples. Highlight duplicates, overdue...
-
-
June 12, 2026
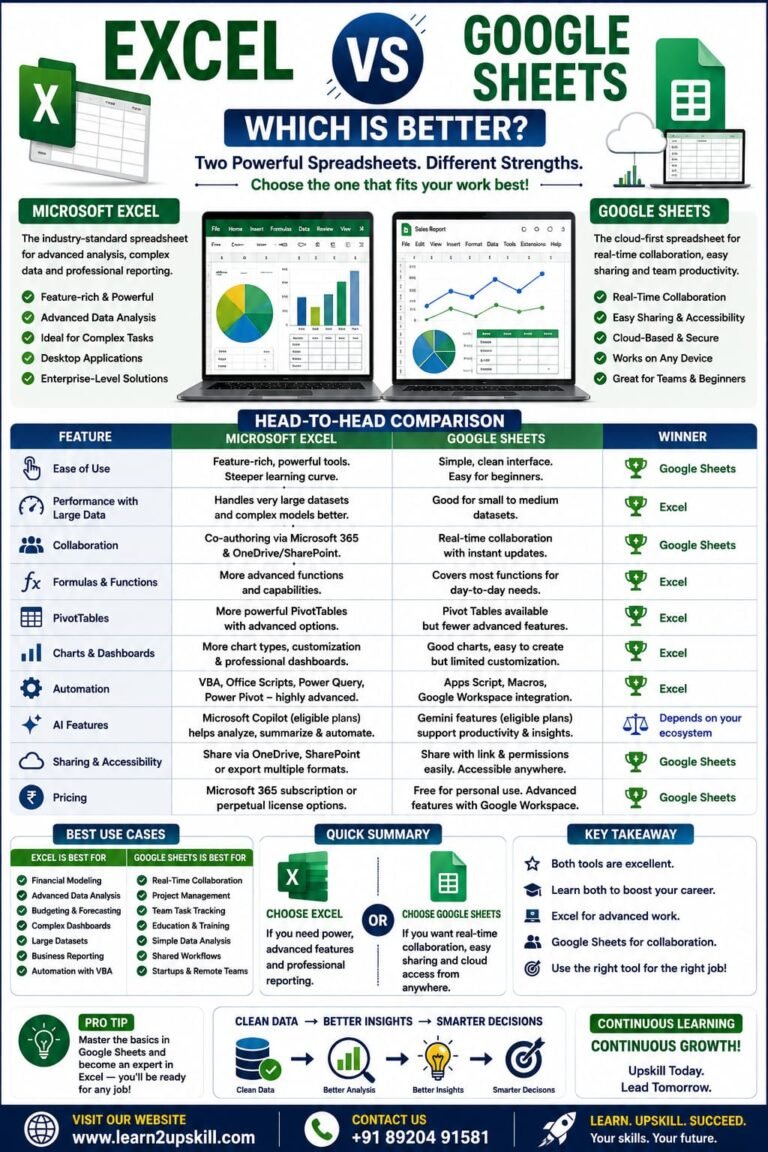
Excel vs Google Sheets: Which Is Better? Compare Microsoft Excel and Google Sheets in terms of features, performance, collaboration, AI...
-
-
June 10, 2026