

How to Use Copilot in Excel for Faster Analysis
How to Use Copilot in Excel for Faster Analysis
Learn how to use Microsoft Copilot in Excel to analyze data faster, generate formulas, create charts, summarize reports, clean data, and boost productivity with AI.
How to Use Copilot in Excel for Faster Analysis
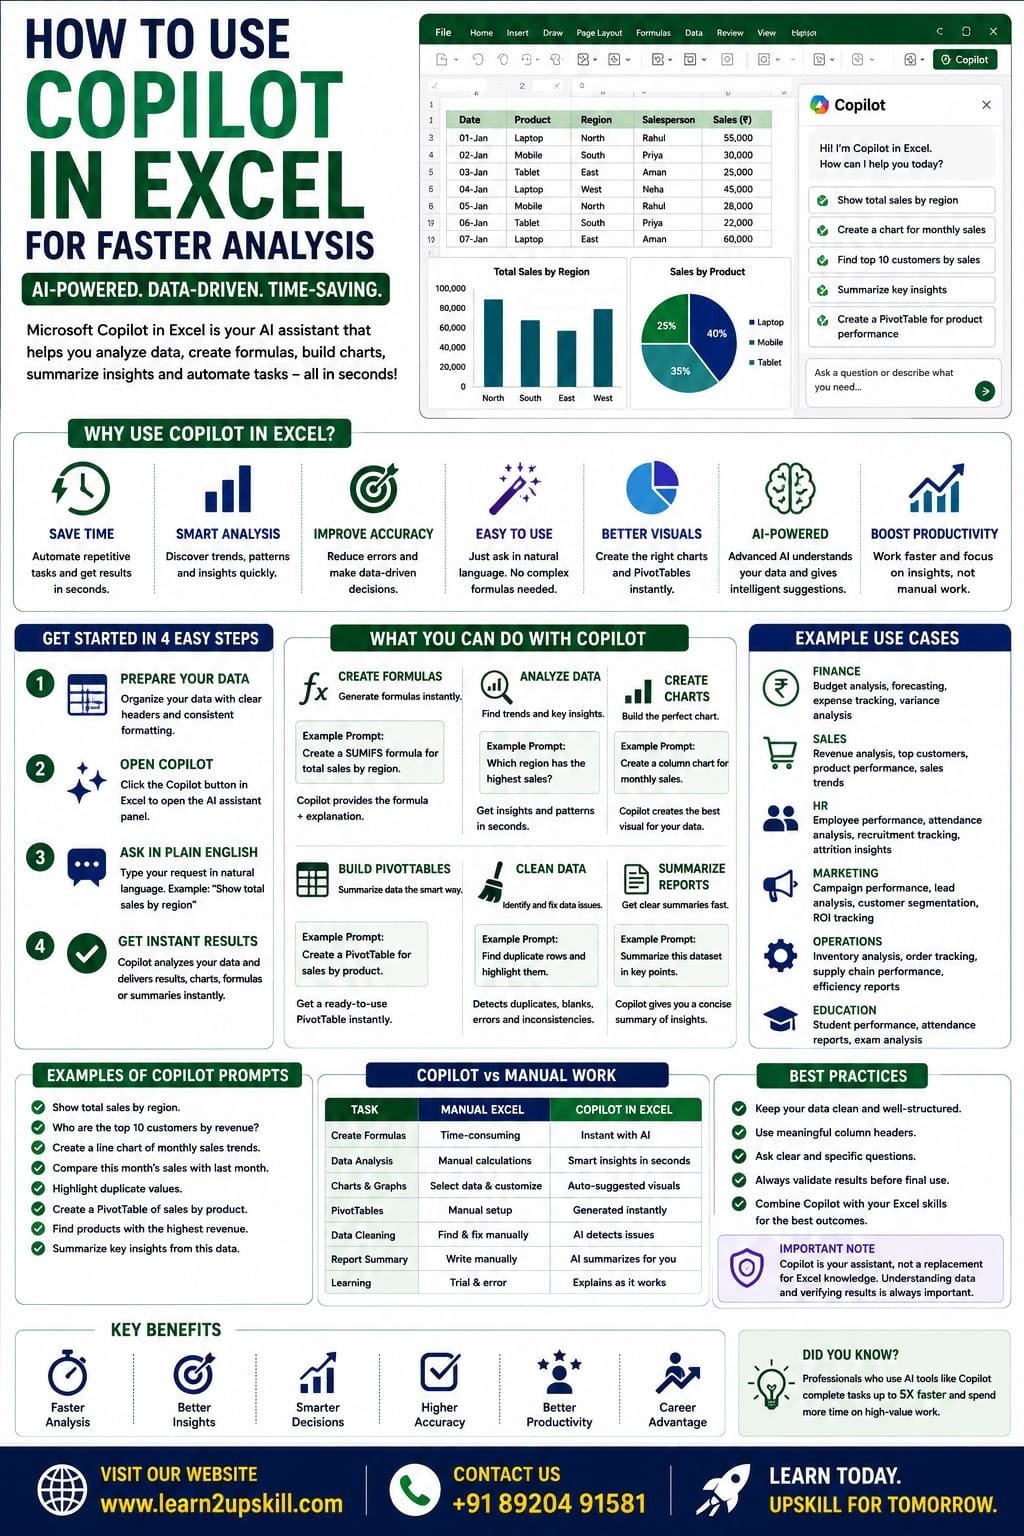
Artificial Intelligence (AI) is changing the way professionals work with spreadsheets, and Microsoft Copilot in Excel is one of the biggest innovations in recent years. Instead of manually creating formulas, Pivot Tables, or charts, you can simply describe what you need in plain English, and Copilot helps you perform complex tasks in seconds.
Whether you’re working in finance, HR, sales, marketing, operations, or education, Copilot can help you analyze data faster, automate repetitive tasks, and make better decisions.
In this guide, you’ll learn how to use Copilot in Excel, its key features, real-world examples, best practices, and limitations.
What is Microsoft Copilot in Excel?
Microsoft Copilot is an AI-powered assistant integrated into supported versions of Microsoft Excel. It uses advanced AI to understand your requests written in natural language and assists with tasks such as:
– Creating formulas
– Summarizing data
– Building PivotTables
– Generating charts
– Identifying trends
– Cleaning data
– Creating reports
– Explaining formulas
Instead of memorizing complicated Excel functions, you can simply ask Copilot what you want to achieve.
Why Use Copilot in Excel?
Copilot helps users:
– Save time
– Reduce manual work
– Improve accuracy
– Analyze data quickly
– Build reports faster
– Learn Excel more efficiently
It is useful for both beginners and experienced Excel professionals.
Requirements Before Using Copilot
To use Copilot in Excel, you generally need:
– A supported Microsoft 365 subscription with Copilot access
– A compatible version of Microsoft Excel
– An internet connection for AI-powered features
– Well-structured data with clear column headers
Availability may vary based on your Microsoft 365 plan and region.
Step 1: Organize Your Data
Before asking Copilot for help:
Ensure your data:
– Has column headers
– Contains no blank header rows
– Uses consistent formatting
– Is stored as an Excel Table whenever possible
Example:
Date| Product| Region| Salesperson| Sales (₹)
01-Jan| Laptop| North| Rahul| 55,000
02-Jan| Mobile| South| Priya| 30,000
03-Jan| Tablet| East| Aman| 25,000
Clean data leads to better AI suggestions.
Step 2: Open Copilot
In supported versions of Excel:
- Open your workbook.
- Select your dataset.
- Click the Copilot button from the Excel ribbon or side panel (location may vary by version).
- Type your request in natural language.
Step 3: Ask Questions in Plain English
Instead of writing formulas, ask questions like:
– Show total sales by region.
– Find the top 10 customers.
– Calculate average monthly sales.
– Highlight duplicate values.
– Show products with the highest revenue.
– Summarize this dataset.
Copilot interprets your request and suggests results.
Create Excel Formulas with Copilot
You don’t need to remember complex functions.
Example prompts:
– Create a SUMIFS formula.
– Find the employee with the highest salary.
– Calculate yearly growth.
– Create an XLOOKUP formula.
– Generate an IF formula for bonus eligibility.
Copilot generates the appropriate formula and explains it if needed.
Analyze Large Datasets
Imagine you have 50,000 sales records.
Ask Copilot:
– Which region has the highest sales?
– Which products are declining?
– Compare this month with last month.
– Show monthly growth trends.
– Find unusual sales patterns.
Copilot quickly identifies insights that would otherwise take much longer to uncover.
Create Charts Automatically
Instead of manually selecting chart types, ask:
– Create a column chart for monthly sales.
– Show sales trends using a line chart.
– Compare regional performance with a bar chart.
– Create a pie chart showing product contribution.
Copilot recommends suitable visualizations based on your data.
Build PivotTables
Creating PivotTables becomes easier with AI.
Example prompts:
– Create a PivotTable showing sales by region.
– Summarize revenue by product.
– Show average sales by salesperson.
– Count orders by month.
Copilot generates a PivotTable that you can further customize.
Clean Data Faster
Copilot can help identify:
– Duplicate records
– Blank cells
– Inconsistent formatting
– Missing values
– Unexpected patterns
While you should review the suggestions, AI can significantly speed up the cleanup process.
Summarize Reports
If you’re working with large datasets, ask Copilot:
– Summarize key insights.
– Identify top-performing products.
– Explain sales trends.
– Highlight important changes.
This is especially useful before meetings or presentations.
Explain Existing Formulas
Inherited a workbook with complicated formulas?
Ask Copilot:
– Explain this formula.
– Why is this formula returning an error?
– Simplify this formula.
Copilot can help you understand and troubleshoot existing spreadsheets.
Real-World Examples
Finance
– Budget analysis
– Profit tracking
– Expense summaries
– Financial forecasting
Sales
– Revenue analysis
– Top customer reports
– Product performance
– Regional comparisons
HR
– Attendance analysis
– Employee performance
– Recruitment tracking
Marketing
– Campaign performance
– Lead analysis
– Customer segmentation
Education
– Student grades
– Attendance reports
– Performance summaries
Best Practices
– Keep your data clean and organized.
– Use Excel Tables for structured datasets.
– Write clear, specific prompts.
– Verify AI-generated results before making business decisions.
– Continue learning Excel fundamentals alongside AI tools.
Common Mistakes to Avoid
– Asking vague questions.
– Using poorly structured data.
– Assuming AI results are always correct.
– Ignoring data validation.
– Depending entirely on AI without understanding the analysis.
Advantages of Copilot in Excel
– Faster reporting
– Easier formula creation
– Simplified data analysis
– Better charts and summaries
– Reduced manual work
– Improved productivity
– Helpful for learning Excel features
Limitations
– Requires eligible Microsoft 365 access.
– Needs internet connectivity for AI features.
– Works best with clean, structured data.
– Complex business scenarios may still require manual review and advanced Excel skills.
Final Thoughts
Microsoft Copilot is making Excel faster, smarter, and more accessible by allowing users to interact with spreadsheets using natural language. From generating formulas and PivotTables to creating charts and summarizing reports, Copilot can dramatically reduce the time spent on repetitive tasks.
However, the best results come from combining AI with strong Excel fundamentals. By understanding formulas, PivotTables, dashboards, and data cleaning—and then using Copilot to accelerate your workflow—you’ll be better equipped for today’s data-driven workplace.
At Learn2Upskill, we help students and professionals master Excel, AI tools, and data analytics through practical, career-focused learning.
Visit: www.learn2upskill.com
Contact Us: +91 89204 91581
Learn Faster. Analyze Smarter. Upskill with AI.
You May Also Like
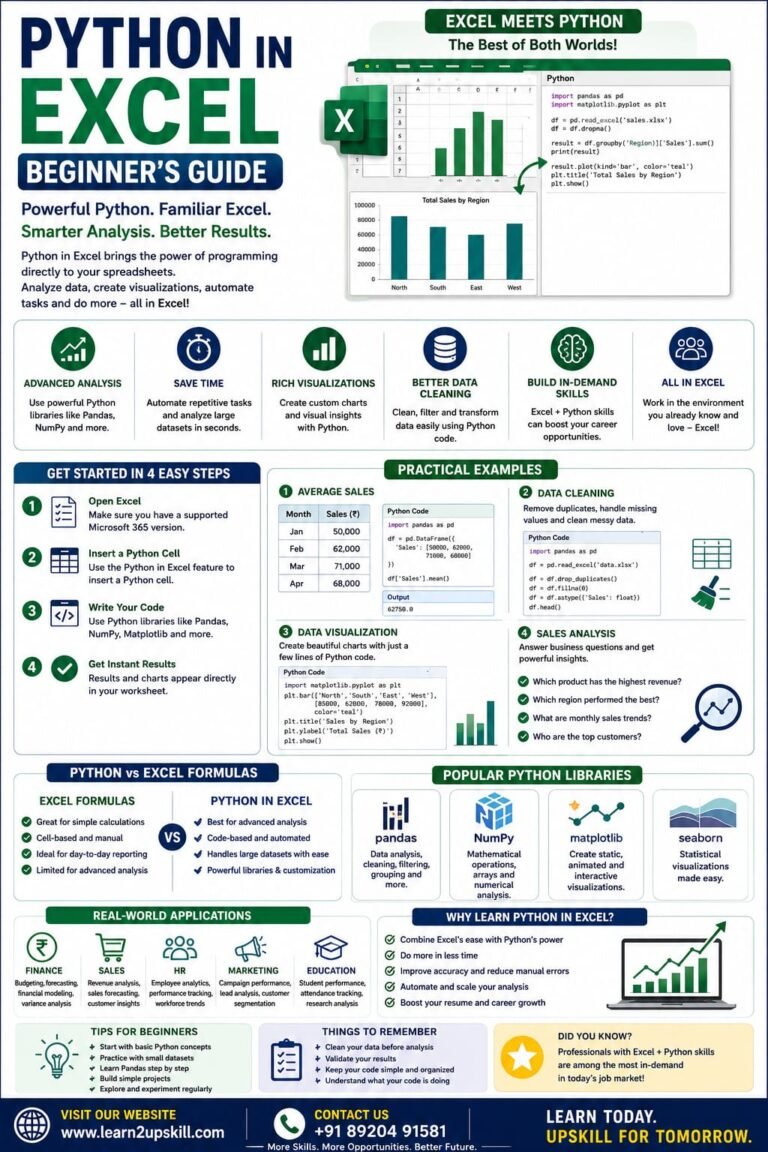
Python in Excel Learn how to use Python in Microsoft Excel with this beginner-friendly guide. Discover setup, syntax, examples, benefits,...
-
-
July 20, 2026
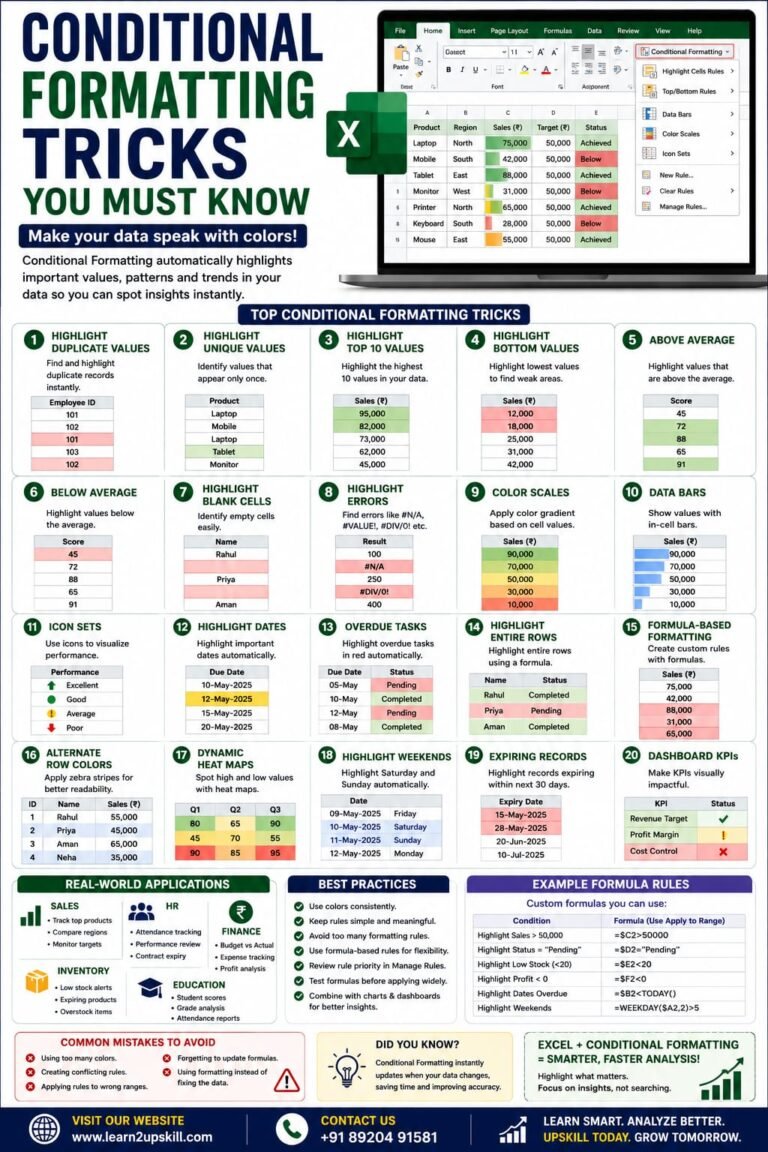
Conditional Formatting Tricks You Must Know) Learn the best Conditional Formatting tricks in Excel with practical examples. Highlight duplicates, overdue...
-
-
June 12, 2026
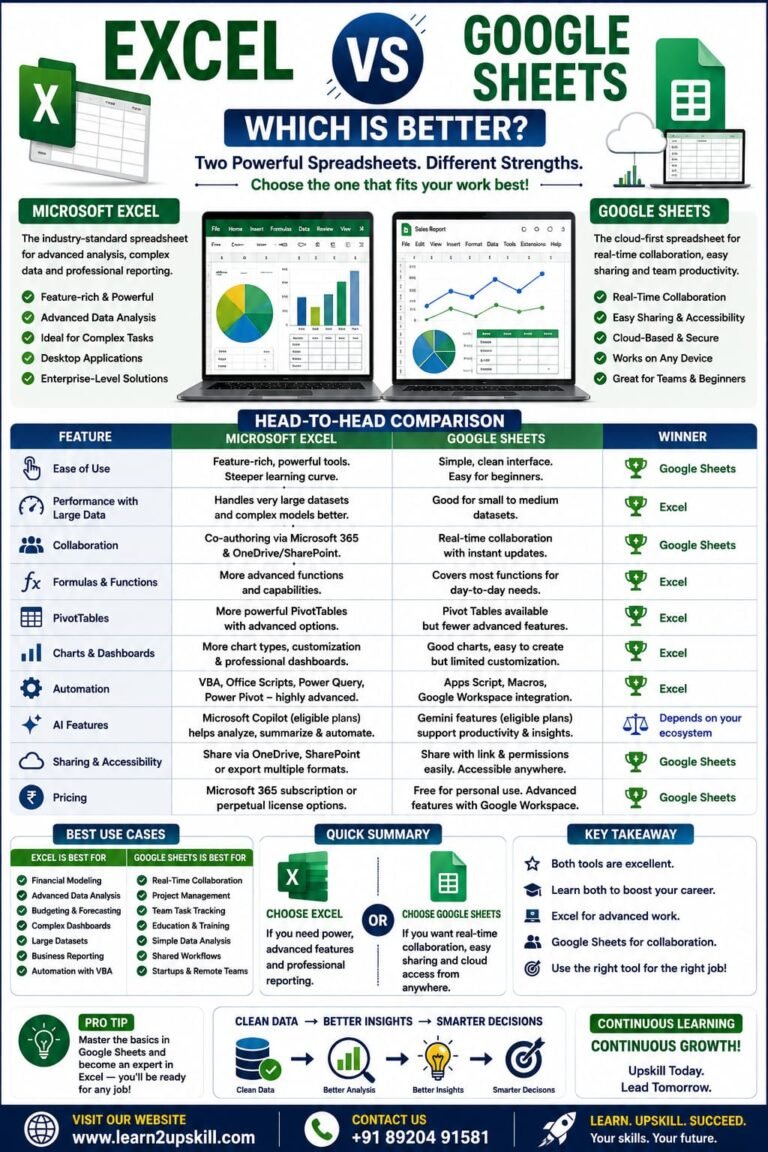
Excel vs Google Sheets: Which Is Better? Compare Microsoft Excel and Google Sheets in terms of features, performance, collaboration, AI...
-
-
June 10, 2026