

Excel Skills That Can Help You Get a Job
Excel Skills That Can Help You Get a Job
Discover the most in-demand Excel skills that can help you get hired. Learn formulas, Pivot Tables, dashboards, charts, automation, AI features, and more with this complete career guide.
Focus Keyword: Excel Skills That Can Help You Get a Job
Excel Skills That Can Help You Get a Job
In today’s competitive job market, Microsoft Excel remains one of the most valuable workplace skills. From multinational companies to startups, organizations rely on Excel to organize data, analyze business performance, create reports, and support decision-making.
Whether you’re a student, fresher, working professional, or job seeker, strong Excel skills can improve your employability and open doors to careers in finance, accounting, HR, marketing, operations, administration, data analysis, and many other fields.
In this guide, we’ll explore the top Excel skills employers look for, why they matter, and how you can build them to strengthen your career.
Why Excel Skills Matter
Excel is used across nearly every industry because it helps professionals:
– Organize large amounts of data
– Perform calculations quickly
– Analyze trends
– Build reports
– Create dashboards
– Visualize information
– Improve business decisions
Employers often list Excel as a required or preferred skill in job descriptions, especially for office-based roles.
Top Excel Skills Employers Want
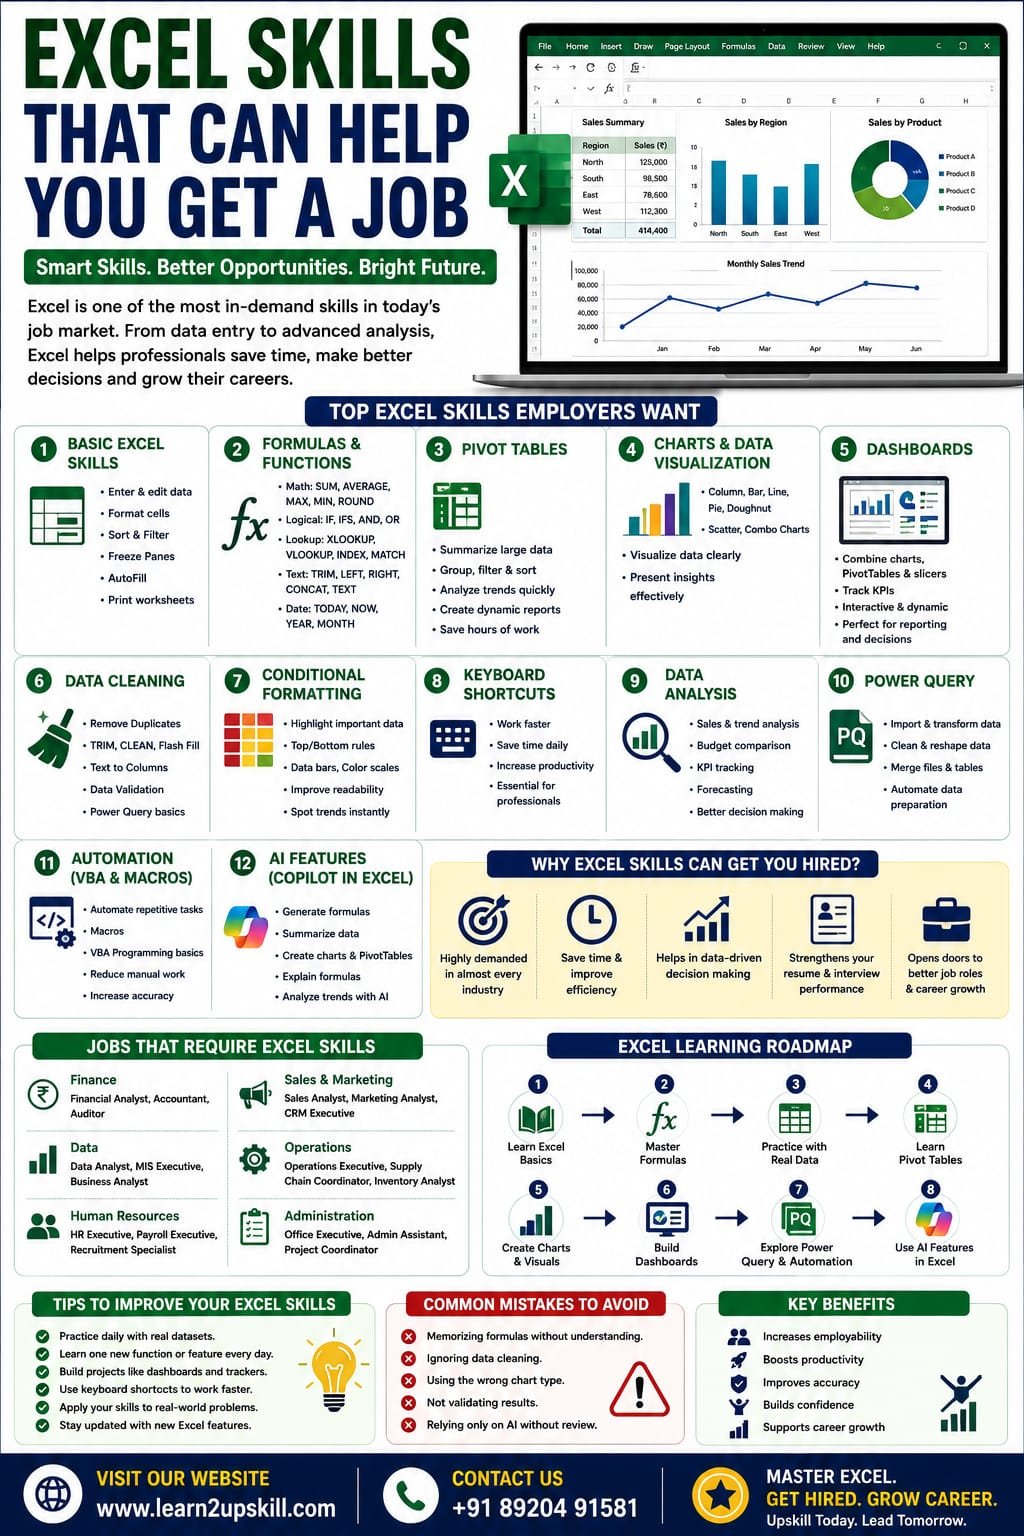
- Basic Excel Skills
Every professional should know how to:
– Create and save workbooks
– Format cells
– Enter and edit data
– Sort and filter information
– Freeze panes
– Print worksheets
– Use AutoFill
These are the building blocks of Excel proficiency.
- Excel Formulas and Functions
Formulas are one of Excel’s greatest strengths.
Essential functions include:
Mathematical
– SUM
– AVERAGE
– MAX
– MIN
– ROUND
Logical
– IF
– IFS
– AND
– OR
Lookup
– XLOOKUP
– VLOOKUP
– INDEX
– MATCH
Text
– TRIM
– LEFT
– RIGHT
– MID
– CONCAT
– TEXT
Date & Time
– TODAY
– NOW
– YEAR
– MONTH
– DATEDIF
Employers value candidates who can use formulas to automate calculations and reduce manual work.
- Pivot Tables
Pivot Tables allow users to summarize thousands of rows of data in seconds.
With Pivot Tables, you can:
– Analyze sales
– Compare regions
– Summarize expenses
– Track employee performance
– Build reports
This is one of the most requested Excel skills in business roles.
- Charts and Data Visualization
Knowing how to present data visually is just as important as analyzing it.
Useful chart types include:
– Column Chart
– Bar Chart
– Line Chart
– Pie Chart
– Doughnut Chart
– Scatter Plot
– Combo Chart
Well-designed charts make reports easier to understand and more impactful.
- Excel Dashboards
Dashboards combine charts, Pivot Tables, slicers, and KPIs into interactive reports.
Professionals use dashboards to monitor:
– Sales performance
– Business growth
– Inventory
– Financial results
– HR metrics
Dashboard skills are especially valuable in analyst and management roles.
- Data Cleaning
Employers expect candidates to work with clean, reliable data.
Important techniques include:
– Remove Duplicates
– TRIM
– CLEAN
– Flash Fill
– Text to Columns
– Find & Replace
– Data Validation
– Power Query basics
Clean data leads to accurate analysis.
- Conditional Formatting
Conditional Formatting helps highlight important information automatically.
Examples:
– Top-performing salespeople
– Overdue tasks
– Low inventory
– Duplicate values
– High expenses
It improves readability and helps users focus on key insights.
- Keyboard Shortcuts
Using shortcuts increases productivity.
Some popular shortcuts include:
– Ctrl + C (Copy)
– Ctrl + V (Paste)
– Ctrl + Z (Undo)
– Ctrl + Shift + L (Filter)
– Ctrl + T (Create Table)
– F4 (Repeat last action or toggle references in formulas)
– Alt + = (AutoSum)
Employers appreciate candidates who can work efficiently.
- Data Analysis
Excel supports a wide range of analytical tasks.
Examples include:
– Sales analysis
– Trend analysis
– Budget comparisons
– Forecasting
– KPI tracking
– Customer insights
Analytical thinking combined with Excel skills is highly valued.
- Power Query
Power Query allows users to:
– Import data
– Clean data
– Merge files
– Transform datasets
– Automate repetitive preparation tasks
It is increasingly used in reporting and business intelligence workflows.
- Automation
Automation helps reduce repetitive work.
Common automation tools include:
– Macros
– VBA (Visual Basic for Applications)
– Office Scripts (supported Microsoft 365 environments)
Automation skills are especially valuable for repetitive reporting tasks.
- AI Features in Excel
Modern Excel includes AI-assisted capabilities in supported Microsoft 365 plans, such as Microsoft Copilot.
These features can help users:
– Generate formulas
– Summarize data
– Create charts
– Build PivotTables
– Explain formulas
– Analyze trends
Understanding how to use AI responsibly alongside core Excel skills can improve productivity.
Which Jobs Require Excel?
Excel is commonly used in roles such as:
Finance
– Financial Analyst
– Accountant
– Auditor
Data
– Data Analyst
– MIS Executive
– Business Analyst
Human Resources
– HR Executive
– Payroll Executive
– Recruiter
Sales & Marketing
– Sales Analyst
– Marketing Analyst
– CRM Executive
Operations
– Operations Executive
– Supply Chain Coordinator
– Inventory Analyst
Administration
– Office Executive
– Administrative Assistant
– Project Coordinator
Tips to Improve Your Excel Skills
– Practice daily with sample datasets.
– Learn keyboard shortcuts.
– Build small projects such as expense trackers or sales reports.
– Create dashboards.
– Solve real-world business problems.
– Keep learning new Excel features as they become available.
Common Mistakes to Avoid
– Memorizing formulas without understanding them.
– Ignoring data cleaning.
– Using the wrong chart type.
– Forgetting to validate results.
– Relying solely on AI without reviewing outputs.
Final Thoughts
Excel is much more than a spreadsheet program—it’s a powerful business tool that supports data analysis, reporting, planning, and decision-making across countless industries.
By mastering formulas, Pivot Tables, charts, dashboards, data cleaning, automation, and AI-assisted features, you’ll build skills that employers actively seek and improve your chances of landing better job opportunities.
The key is consistent practice. Work on real-world datasets, build projects, and keep expanding your knowledge as Excel continues to evolve.
At Learn2Upskill, we help students and professionals develop practical Excel, AI, and data analysis skills through hands-on, career-focused training.
Visit: www.learn2upskill.com
Contact Us: +91 89204 91581
Master Excel. Build Confidence. Get Job-Ready.
You May Also Like
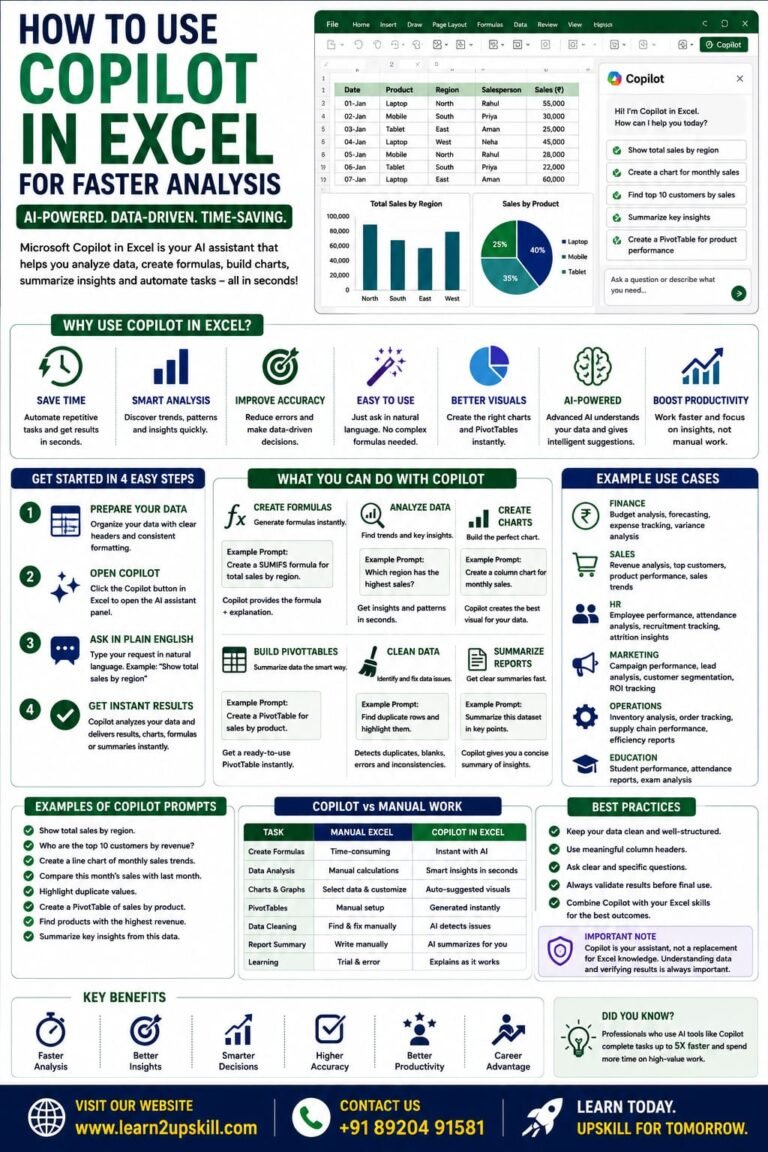
How to Use Copilot in Excel for Faster Analysis Learn how to use Microsoft Copilot in Excel to analyze data...
-
-
July 21, 2026
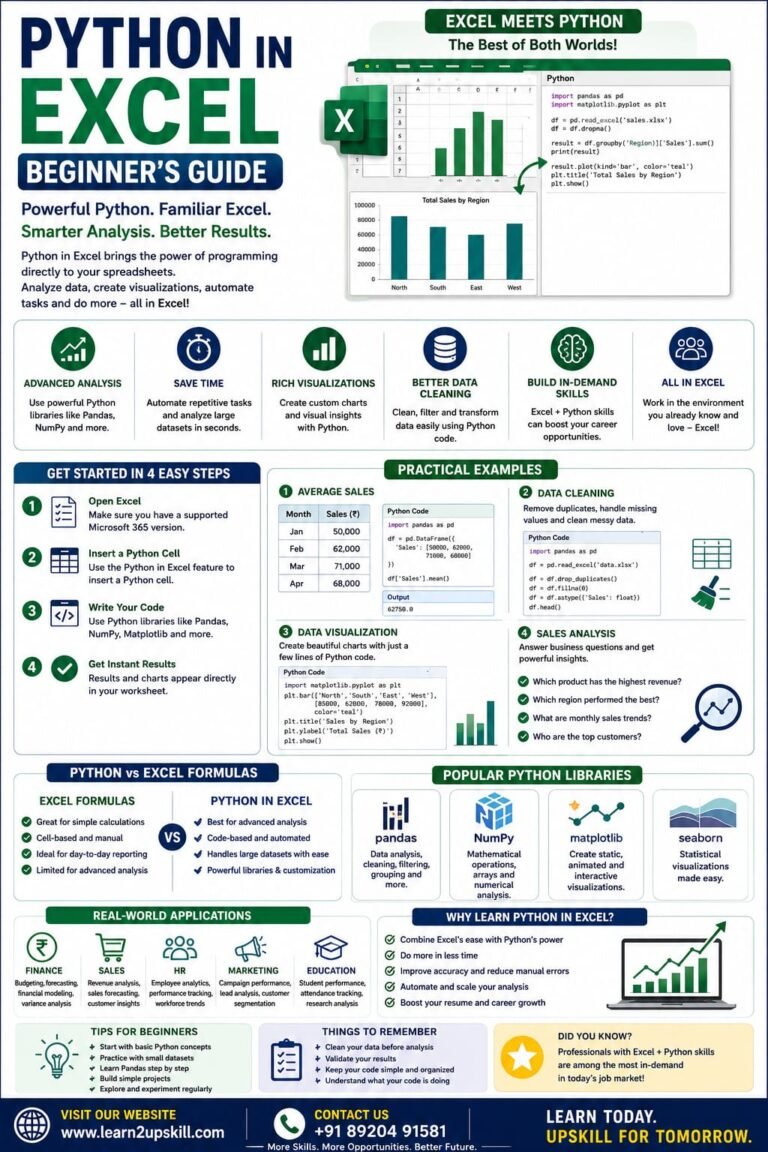
Python in Excel Learn how to use Python in Microsoft Excel with this beginner-friendly guide. Discover setup, syntax, examples, benefits,...
-
-
July 20, 2026
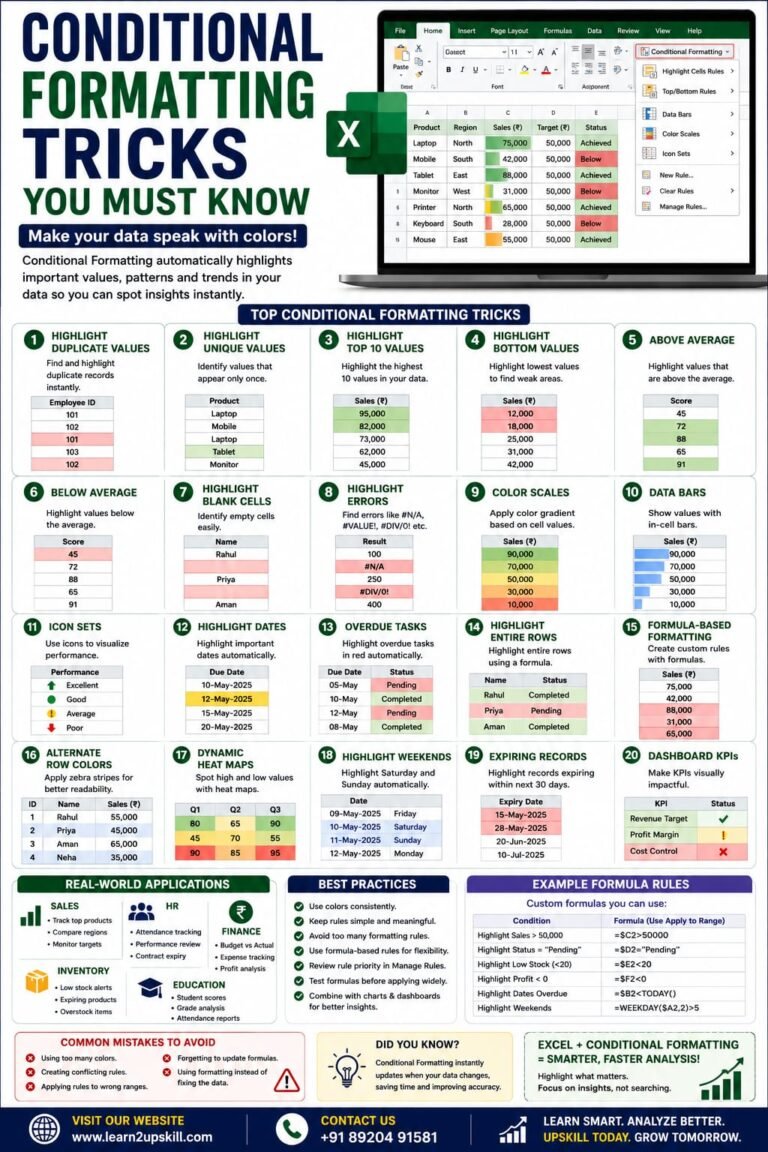
Conditional Formatting Tricks You Must Know) Learn the best Conditional Formatting tricks in Excel with practical examples. Highlight duplicates, overdue...
-
-
June 12, 2026