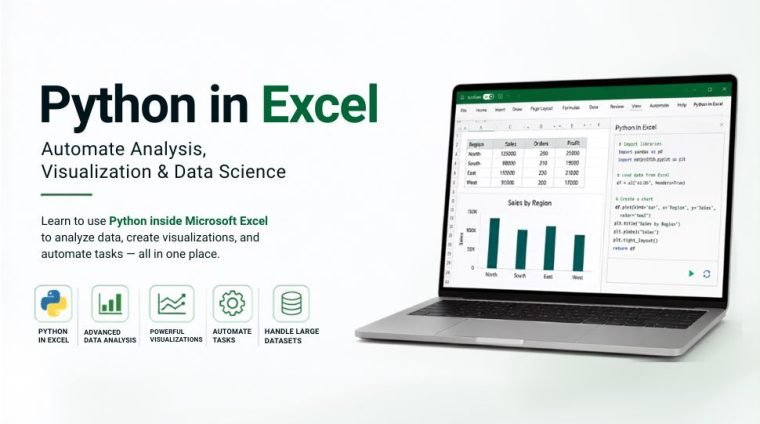

Python in Excel: Automate Analysis, Visualization & Data Science is a practical course designed to help professionals, analysts, students, and business users combine the power of Python with the familiarity of Microsoft Excel. Learn how to perform advanced data analysis, automate repetitive tasks, create powerful visualizations, and solve complex business problems—all without leaving Excel.
This course introduces Python in Excel from the ground up, making it easy for beginners while also providing valuable techniques for experienced Excel users. You’ll learn how to manipulate data using Pandas, perform calculations with NumPy, create professional charts with Matplotlib, and use Python to clean, analyze, and visualize large datasets more efficiently than traditional Excel methods.
Through hands-on projects and real-world business scenarios, you’ll discover how Python transforms Excel into a powerful analytics platform, helping you work faster, make better decisions, and unlock new career opportunities.
Curriculum
- 1 Section
- 1 Lesson
- 10 Weeks
- Python in Excel Course1